Indoor Air Quality Statistics 2026
129 sourced statistics on indoor air, radon, asthma, wildfire smoke and air purifier use, each linked to the page it came from.
By Clean Air Guides editorial teamUpdated 36 min read

This page collects 129 statistics on indoor air quality and the things that shape it, from time spent indoors to radon, wildfire smoke, asthma and air purifier use. Each figure links to the page it came from, and 14 come from our own analysis. All were last verified on November 5, 2026. The focus is the United States, with global figures for household air pollution. Stats are numbered in order so you can refer to one by its number.
Key takeaways
- Americans spend approximately 90 percent of their time indoors, according to EPA, a figure that traces to a 1989 report; average time at home rose by one hour and 39 minutes a day from 2003 to 2022.
- Outdoor sources made up a median 52% of indoor PM2.5 across 3,977 US homes with paired low-cost sensors in 2021-2022, a volunteer sample rather than a random one.
- 152.3 million people, or 44% of Americans, live in places with a failing grade for ozone or particle pollution, according to State of the Air 2026.
- EPA attributes about 21,000 US lung cancer deaths a year to radon, and CDC reports more than 400 US deaths a year from unintentional carbon monoxide poisoning not linked to fires.
- In 2025, 8.5% of US adults and 6.3% of US children currently had asthma, according to National Health Interview Survey estimates.
- In August 2023, 37.9% of US adults said they use a portable air cleaner at home, but only 18.6% said they use one with a HEPA filter.
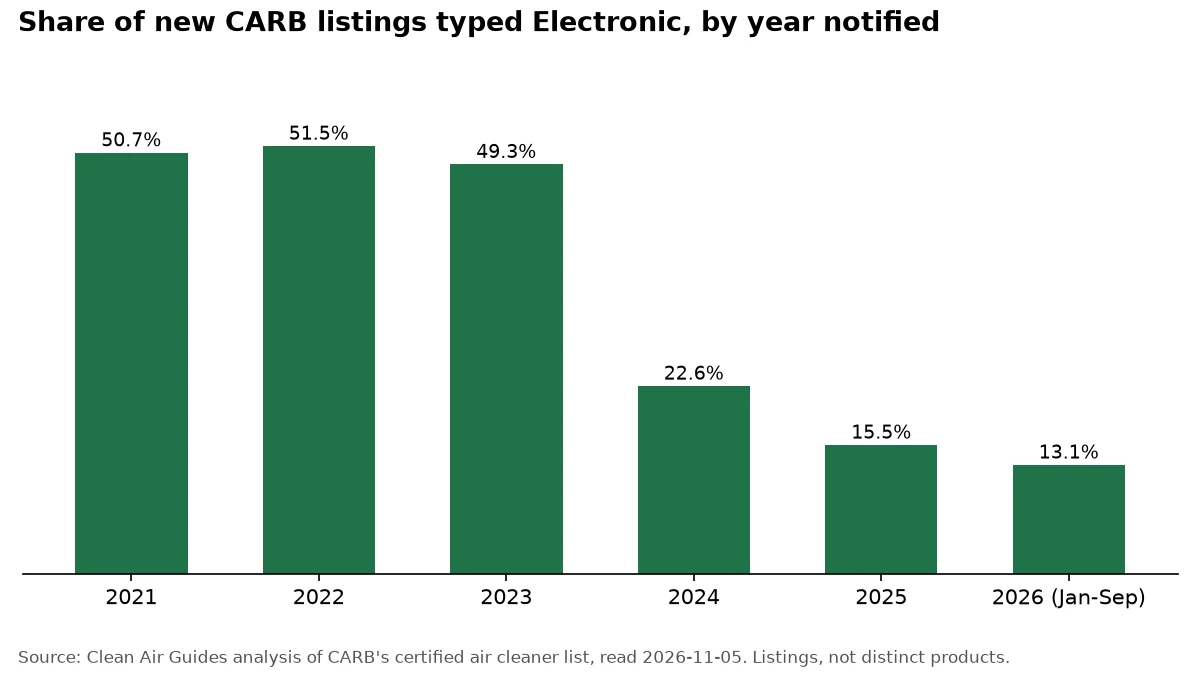
- Our analysis of California’s certified air cleaner list shows units typed Electronic falling from 51.5% of new listings in 2022 to 13.1% in January to September 2026; these are listings, not distinct products or sales.
How much time we spend indoors and what we breathe there
Americans spend most of their time indoors, and how that air compares with outdoor air depends on the pollutant: EPA says some pollutants run higher indoors, while measured PM2.5 in monitored US homes is usually lower indoors but rises during wildfire smoke.
- EPA says Americans spend approximately 90 percent of their time indoors on average, a figure its page footnotes to a 1989 Report to Congress on indoor air quality. (Source: US EPA, Report on the Environment: Indoor Air Quality, 1989)
- Indoor concentrations of some pollutants are often 2 to 5 times higher than typical outdoor levels in the US, according to EPA, citing its 1987 TEAM study; this covers some pollutants, not all. (Source: US EPA, Report on the Environment: Indoor Air Quality, 1987)
- Respondents to the US National Human Activity Pattern Survey, run from 1992 to 1994, reported spending an average of 87% of their time in enclosed buildings and about 6% in enclosed vehicles. (Source: Klepeis et al., The National Human Activity Pattern Survey, Lawrence Berkeley National Laboratory publication record, 1994)
- Average time at home among American adults rose by one hour and 39 minutes in a typical day between 2003 and 2022, according to Patrick Sharkey’s analysis of American Time Use Survey data. (Source: Sharkey, Homebound: The Long-Term Rise in Time Spent at Home Among U.S. Adults, Sociological Science, 2022)
- In 2025, 35 percent of employed Americans did some or all of their work at home on days they worked, according to the Bureau of Labor Statistics American Time Use Survey. (Source: US Bureau of Labor Statistics, American Time Use Survey, 2025 results)
- US workers who worked at home on an average day in 2025 put in 5.10 hours there, compared with 7.87 hours for those working at their workplace, per BLS American Time Use Survey annual averages. (Source: US Bureau of Labor Statistics, American Time Use Survey, Table 6, 2025)
- Time-averaged indoor PM2.5 was below outdoor levels in 92% of 3,977 US residences with PurpleAir monitors in 2021 and 2022, with means of 3.31 and 5.99 µg/m³; most sites were on the West Coast. (Source: Lunderberg et al., PNAS, 2023, Assessing residential PM2.5 concentrations using crowdsourced sensors, 2022)
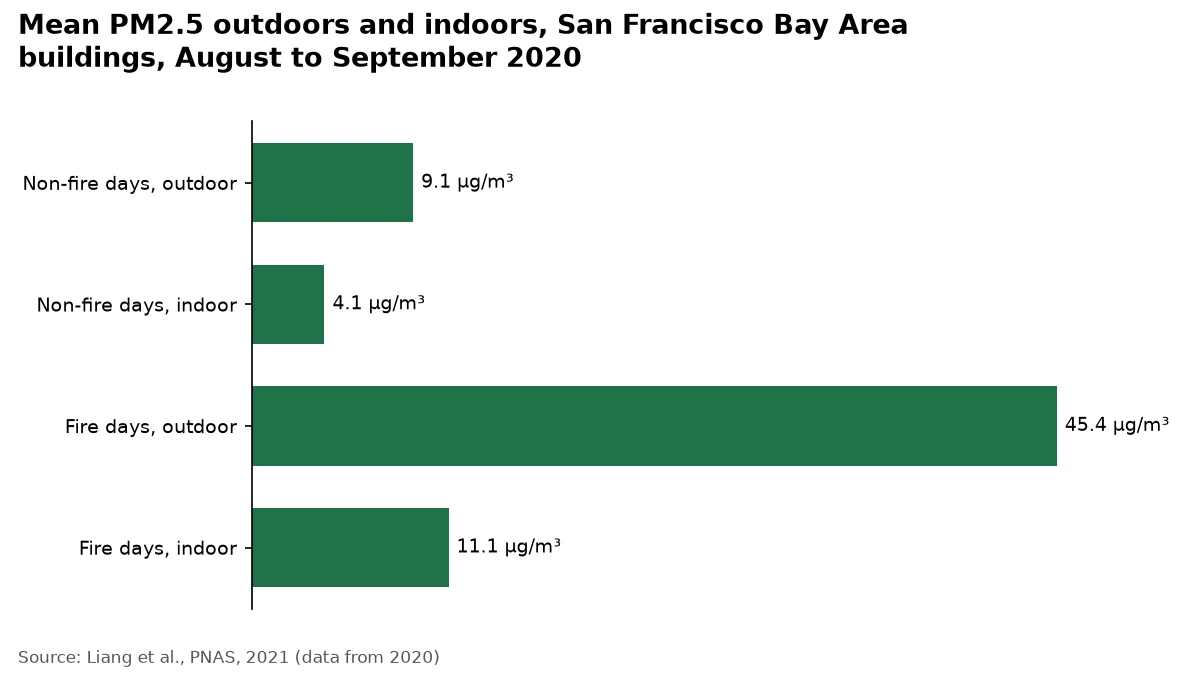
- In San Francisco Bay Area buildings with PurpleAir sensors in August to September 2020, mean indoor PM2.5 was 11.1 µg/m³ on fire days and 4.1 on non-fire days, against outdoor means of 45.4 and 9.1. (Source: Liang et al., PNAS, 2021, Wildfire smoke impacts on indoor air quality assessed using crowdsourced data in California, 2020)
Related: how to improve indoor air quality, the best air quality monitors.
Household air pollution worldwide
Household air pollution still accounts for millions of deaths a year, and while access to clean cooking reached 75 per cent of the world in 2024, sub-Saharan Africa remains furthest behind at 22 per cent.
- Household air pollution was responsible for an estimated 2.9 million deaths per year worldwide in 2021, according to WHO. (Source: WHO, Household air pollution fact sheet, 2021)
- Over 309 000 of the deaths WHO attributes to household air pollution in 2021 were children under the age of 5. (Source: WHO, Household air pollution fact sheet, 2021)
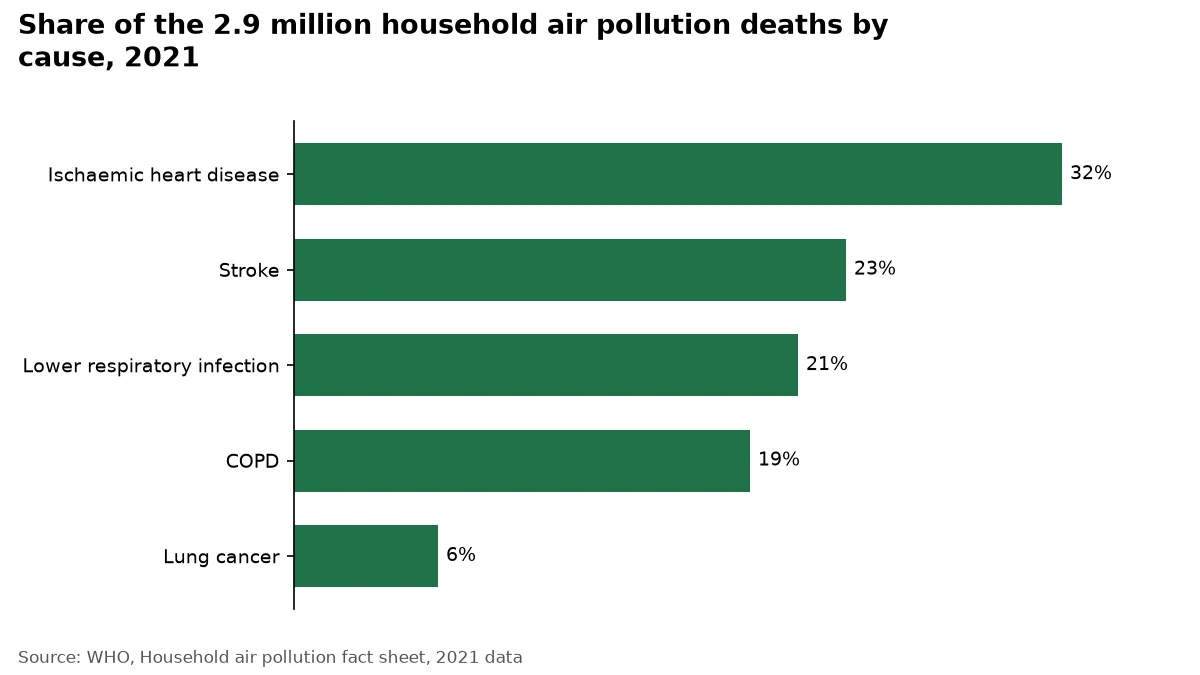
- Of the 2.9 million deaths WHO attributes to household air pollution, 32% are from ischaemic heart disease, 23% stroke, 21% lower respiratory infection, 19% COPD and 6% lung cancer. (Source: WHO, Household air pollution fact sheet, 2021)
- In 2021, 14% of people in urban areas relied on polluting cooking fuels and technologies, compared with 49% of the global rural population, according to WHO. (Source: WHO, Household air pollution fact sheet, 2021)
- Household air pollution was attributed to 2.8 million deaths worldwide in 2023, out of 7.9 million deaths linked to air pollution overall, according to the State of Global Air 2025 report. (Source: State of Global Air 2025 report (Health Effects Institute, IHME), 2023)
- About one-third of the world’s population, almost 2.6 billion people, were exposed to pollution from burning solid fuels for cooking at home in 2023. (Source: State of Global Air 2025 report page (Health Effects Institute, IHME), 2023)
- Access to clean cooking fuels and technologies reached 75 per cent of the global population in 2024, up 11 percentage points since 2015, according to the UN. (Source: United Nations, The Sustainable Development Goals Report 2026, Goal 7, 2024)
- Only 22 per cent of people in sub-Saharan Africa had access to clean cooking fuels and technologies in 2024, according to the UN. (Source: United Nations, The Sustainable Development Goals Report 2026, Goal 7, 2024)
- Nearly 12 million people in sub-Saharan Africa gained access to clean cooking in 2024, but population growth meant the number without access still rose by around 14 million, the IEA reports. (Source: IEA, Clean Cooking in Africa 2026, Executive summary, 2024)
- The World Bank’s 2020 report estimated that cooking with traditional polluting fuels costs the world more than $2.4 trillion each year, including $1.4 trillion in health impacts. (Source: World Bank, The State of Access to Modern Energy Cooking Services, 2020)
- The Global Burden of Disease 2021 study estimated that 33.8% of the world’s population, 2.67 billion people, were exposed to household air pollution from all sources in 2021. (Source: GBD 2021 Household Air Pollution Collaborators, The Lancet, 2025 (abstract on McMaster Experts record))
The outdoor air that gets inside
US emissions have fallen sharply since 1970, yet 44% of Americans still live in places with a failing air grade, and in monitored US homes outdoor sources made up a median 52% of indoor PM2.5.
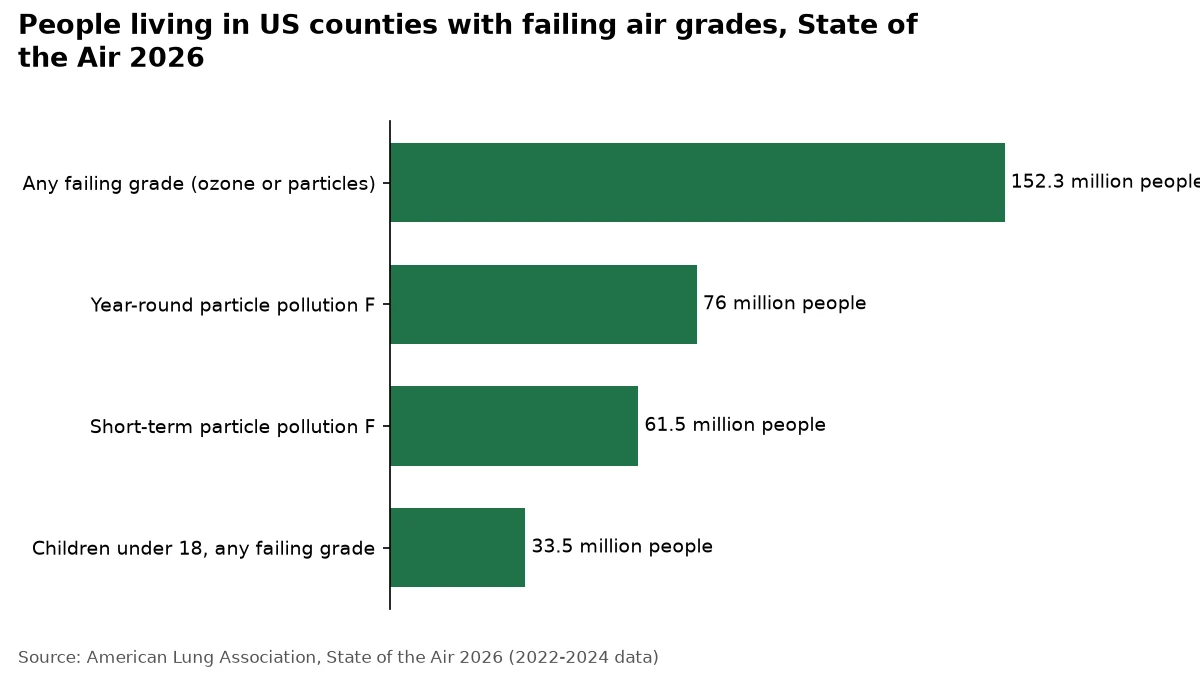
- 152.3 million people, or 44% of Americans, live in places with a failing grade for ozone or particle pollution, according to State of the Air 2026, which uses 2022-2024 data. (Source: American Lung Association, State of the Air 2026, 2024)
- 33.5 million US children under 18, or 46% of all kids, live in counties with a failing grade on at least one air pollution measure, according to State of the Air 2026 (2022-2024 data). (Source: American Lung Association, State of the Air 2026, 2024)
- 61.5 million people live in US counties that earned an F for short-term spikes in particle pollution in State of the Air 2026 (2022-2024 data). (Source: American Lung Association, State of the Air 2026, 2024)
- 76 million people live in US counties that received a failing grade for year-round particle pollution in State of the Air 2026 (2022-2024 data). (Source: American Lung Association, State of the Air 2026, 2024)
- A person of color in the US is 2.42 times as likely as a white person to live in a community with failing grades on all three pollution measures, State of the Air 2026 found (2022-2024 data). (Source: American Lung Association, State of the Air 2026, 2024)
- Approximately 115 million people in the US lived in counties with pollution levels above the primary national ambient air quality standards in 2025, EPA reports. (Source: US EPA, Air Quality National Summary, 2025)
- Total US emissions of the six principal air pollutants dropped by 78 percent between 1970 and 2025, while the US population grew by 67 percent, according to EPA. (Source: US EPA, Air Quality National Summary, 2025)
- US annual PM2.5 concentrations show a change of -45 percent from 2000 to 2025 in EPA’s national air quality trends table. (Source: US EPA, Air Quality National Summary, 2025)
- The US annual average PM2.5 level increased to 7.3 µg/m³ in 2025, according to IQAir’s 2025 World Air Quality Report, which measures against a WHO guideline of 5 µg/m³. (Source: IQAir, 2025 World Air Quality Report (news release))
- El Paso, Texas, was the most polluted major US city in IQAir’s 2025 report: historic dust storms drove a 46% increase in its PM2.5 level to 11.4 µg/m³. (Source: IQAir, 2025 World Air Quality Report (news release))
- 77% of Americans said they worry their local area might be harmed by air pollution, in the Spring 2026 wave of the Yale Program on Climate Change Communication’s Climate Change in the American Mind survey. (Source: Yale Program on Climate Change Communication, Climate Change in the American Mind: Beliefs & Attitudes, Spring 2026)
- US PM2.5 pollution rose 20 percent from 2022 to 2023, the largest year-on-year increase since the University of Chicago’s Air Quality Life Index data begin in 1998. (Source: Energy Policy Institute at the University of Chicago, AQLI United States Fact Sheet 2025, 2023)
- Outdoor sources made up a median 52% of residential PM2.5 across 3,977 US homes with paired indoor and outdoor low-cost sensors, in a PNAS study of 2021-2022 PurpleAir data with a Berkeley Lab co-author. (Source: Lunderberg et al., PNAS 2023, 2022)
- In Berkeley Lab tests in one unoccupied 2006 Sacramento house near a freeway, supply ventilation with MERV16 filtration cut PM2.5 by 97-98% relative to outdoors, while exhaust ventilation without enhanced filtration left it 70% lower. (Source: Singer et al., Lawrence Berkeley National Laboratory report, 2016)
Related: whether air purifiers work, the best furnace filters.
Wildfire smoke
US burned area swings widely from year to year, and smoke travels far: in 2023, when US fires burned 2,693,910 acres, an estimated 267 million people in the US had at least one day of Canadian-smoke pollution above the WHO daily guideline.
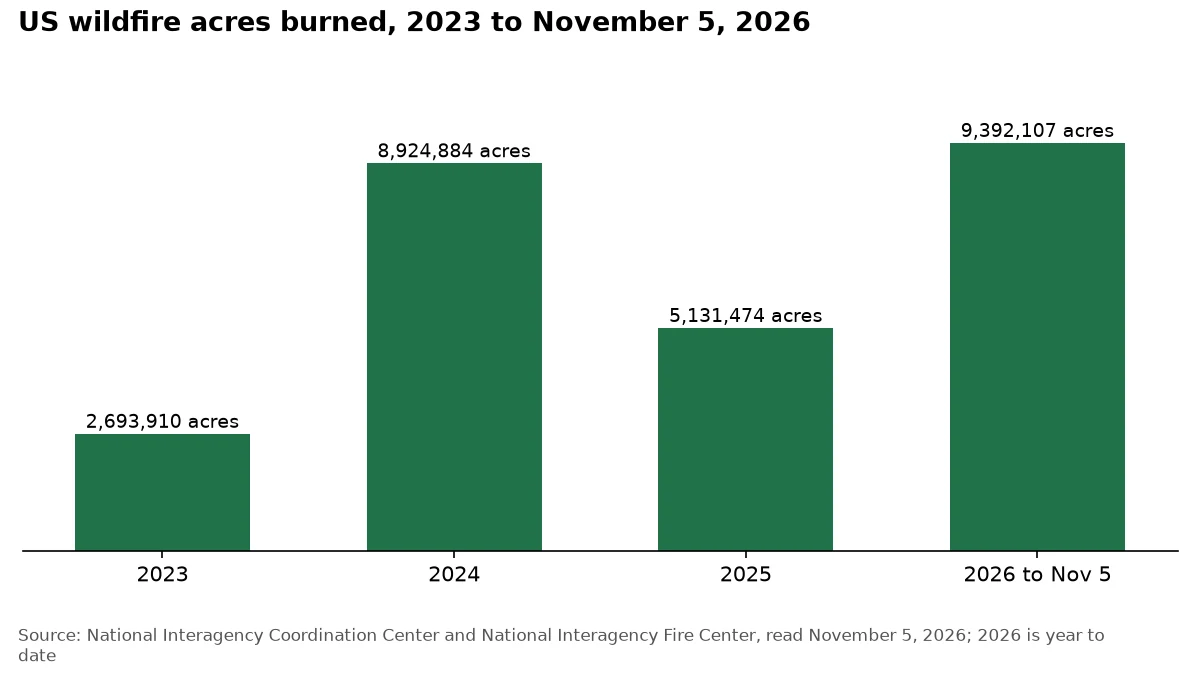
- US wildfires had burned 9,392,107 acres in 2026 as of November 5, already above the full-year totals for 2024 and 2025, across 68,039 wildfire incidents, according to NIFC’s year-to-date count. (Source: National Interagency Fire Center, Statistics, 2026)
- US wildfires burned 5,131,474 acres in 2025 across 77,850 fires, according to National Interagency Coordination Center totals published by NIFC. (Source: National Interagency Fire Center, Total Wildland Fires and Acres (1983-2025))
- US wildfires burned 8,924,884 acres in 2024 across 64,897 fires, according to National Interagency Coordination Center totals published by NIFC. (Source: National Interagency Fire Center, Total Wildland Fires and Acres (1983-2025), 2024)
- US wildfires burned 2,693,910 acres in 2023 across 56,580 fires, according to National Interagency Coordination Center totals published by NIFC. (Source: National Interagency Fire Center, Total Wildland Fires and Acres (1983-2025), 2023)
- Canada’s 2025 wildfires burned roughly 8.9 million hectares, ranking second only to 2023 for area burned, Environment and Climate Change Canada reports. (Source: Environment and Climate Change Canada, Canada’s top 10 weather stories of 2025)
- An estimated 267 million people in the US were exposed in 2023 to at least one day when PM2.5 topped 15 µg/m³ and Canadian fires supplied at least half of it, a Nature study found. (Source: Long-range PM2.5 pollution and health impacts from the 2023 Canadian wildfires, Nature 2025)
- Nearly 25 million people in the contiguous US lived where smoke PM2.5 topped 100 µg/m³ on at least one day in 2020, part of a 27-fold rise over the prior decade, Childs et al. estimated. (Source: Childs et al., Environmental Science & Technology 2022, 2020)
- From 2007 to 2018, fire smoke supplied over 25% of daily PM2.5 for more than one month a year at about 40% of US regulatory air monitors, according to a study in Environmental Science & Technology. (Source: Wildland Fires Worsened Population Exposure to PM2.5 Pollution in the Contiguous United States, Environ Sci Technol, 2018)
- Since at least 2016, wildfire smoke has influenced PM2.5 trends in nearly three-quarters of contiguous US states, eroding about 25% of earlier multi-decade progress on average in those states, using data through 2022. (Source: Burke et al., The contribution of wildfire to PM2.5 trends in the USA, Nature 2023, 2022)
- Stanford researchers estimate wildfire smoke caused 41,380 excess US deaths per year during 2011-2020, and that the toll could rise more than 70% by 2050 under a business-as-usual emissions scenario. (Source: Stanford University, summary of Qiu et al., Nature 2025, 2020)
- Across more than 1,400 California buildings, the share of outdoor PM2.5 getting indoors fell from a ratio of 0.4 on non-fire days to 0.2 on wildfire days, yet mean indoor PM2.5 still nearly tripled during fires. (Source: Liang et al., PNAS 2021, in the NOAA Institutional Repository, 2020)
- During smoke events, indoor PM2.5 often stays 3–4× above health-based guidelines and differs by 20× between neighbouring households, according to a 2022 Nature Human Behaviour study of US wildfire smoke. (Source: Burke et al., Exposures and behavioural responses to wildfire smoke, Nature Human Behaviour 2022)
- California wildfires burned 1.02 million acres in 2024 and emitted an estimated 308 thousand short tons of PM2.5, above the 2000-2024 average of 289 thousand short tons, according to the California Air Resources Board. (Source: California Air Resources Board, California Wildfire Emissions Estimates, 2024)
Related: keeping wildfire smoke out of your home, the best air purifiers for wildfire smoke.
Asthma and allergies
About 8.5% of US adults and 6.3% of children had current asthma in 2025, roughly three in ten had a diagnosed allergic condition in 2024, and long-term pollen records show seasons starting earlier.
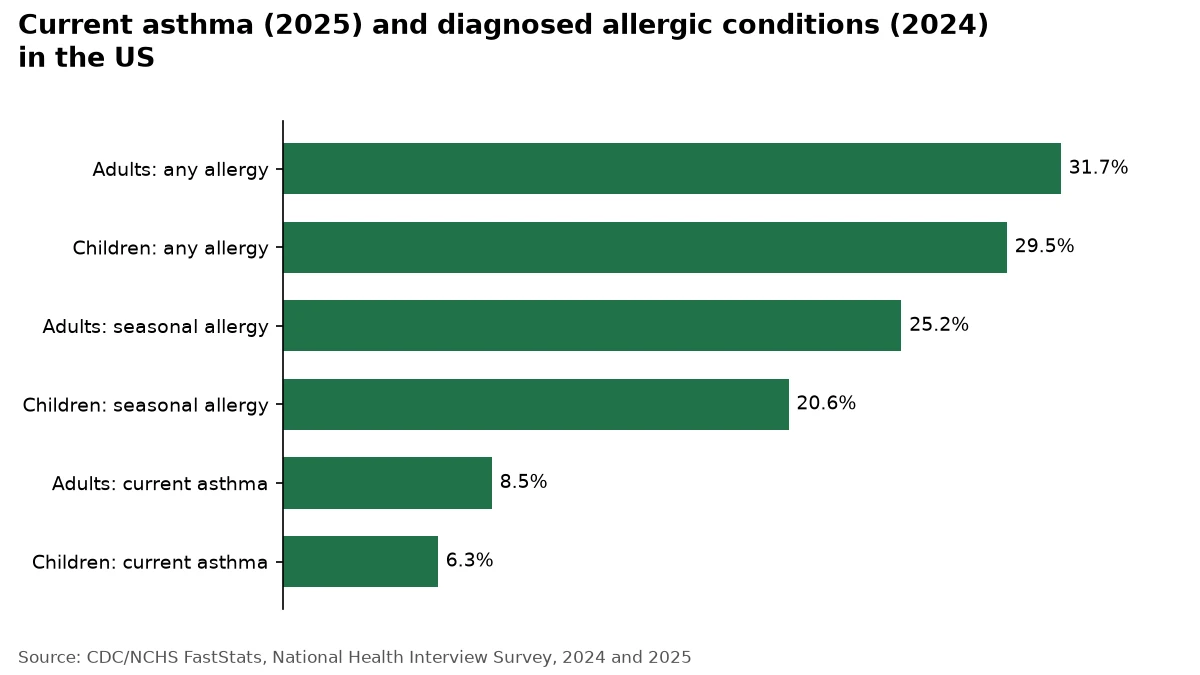
- In 2025, 8.5% of US adults and 6.3% of US children under 18 currently had asthma, according to National Health Interview Survey estimates. (Source: CDC/NCHS, FastStats: Asthma, 2025)
- An estimated 27,807,000 people in the US had current asthma in 2023, equal to 8.4 percent of the population, the latest national headcount CDC has posted. (Source: CDC, Most Recent Asthma Data, 2023)
- US hospitals had an estimated 1,009,419 asthma emergency department visits and 131,985 asthma hospital stays in 2023. (Source: CDC, Most Recent Asthma Data, 2023)
- Asthma was recorded as the cause of 3,722 deaths in the US in 2024, a rate of 1.1 deaths per 100,000 population. (Source: CDC/NCHS, FastStats: Asthma, 2024)
- In 2024, 31.7% of US adults and 29.5% of US children had a diagnosed seasonal allergy, eczema or food allergy; seasonal allergy was the most common, at 25.2% of adults and 20.6% of children. (Source: CDC/NCHS, FastStats: Allergies and Hay Fever, 2024)
- In 2022, 44.2 million Americans, or 13.5%, had been diagnosed with asthma by a health professional at some point in their lives. (Source: American Lung Association, Asthma Trends and Burden, 2022)
- Among Americans with current asthma in 2022, 42.4%, or 11.3 million people, had at least one asthma attack that year. (Source: American Lung Association, Asthma Trends and Burden, 2022)
- In 2018, 2.2 million US children aged 5 to 17 missed more than 7.9 million school days, per the American Lung Association’s asthma burden data. (Source: American Lung Association, Asthma Trends and Burden, 2018)
- In 2022, current asthma was reported by 10.3% of Black individuals in the US, compared with 8.4% of white individuals. (Source: American Lung Association, Current Asthma Demographics, 2022)
- In 2023, current asthma among US adults ranged from 7.1% in Mississippi to 14.1% in Puerto Rico. (Source: American Lung Association, Current Asthma Demographics, 2023)
- Allentown, Pennsylvania ranked #1 of 100 US metro areas in AAFA’s 2026 Asthma Capitals report, which scores asthma prevalence, emergency visits and deaths, with the highest asthma emergency visit rate of the areas analyzed. (Source: Asthma and Allergy Foundation of America, 2026 Asthma Capitals press release, 2025)
- AAFA estimates that asthma’s economic cost in the US will be at least $118 billion in 2026, an inflation adjustment of an earlier CDC-authored estimate. (Source: Asthma and Allergy Foundation of America, 2026 Asthma Capitals report)
- Boise, Idaho ranked first among 100 metro areas in AAFA’s 2026 Allergy Capitals report after ranking 95 a year earlier, a jump AAFA ties to longer, heavier 2025 pollen and fewer allergy specialists. (Source: Asthma and Allergy Foundation of America, 2026 Allergy Capitals report, 2025)
- At 60 North American pollen stations from 1990 to 2018, pollen seasons began about 20 days earlier and lasted about 8 days longer, and annual pollen rose 20.9%. (Source: Anderegg et al., PNAS 2021 (PubMed Central copy), 2018)
- The freeze-free growing season, the window when plants can grow and release pollen, lengthened in 87% of 198 US cities from 1970 to 2025, by 21 days on average. (Source: Climate Central, Warmer Growing Season, Longer Allergy Season, 2025)
- The US Northwest had the biggest gain in freeze-free growing season from 1970 to 2025, at +31 days on average, while the Northern Rockies and Plains gained +15 days. (Source: Climate Central, Warmer Growing Season, Longer Allergy Season, 2025)
- A modeling study projected that annual US pollen emissions could rise 16–40% by the end of the century under a high-emissions scenario, with spring emissions starting 10 to 40 days earlier. (Source: Zhang and Steiner, Nature Communications 2022)
Related:
Radon
EPA’s standing estimate links radon to about 21,000 US lung cancer deaths a year, shares of tests above the action level differ widely by state, and in Minnesota only about 1% or 2% of homes are tested annually.
- EPA attributes about 21,000 US lung cancer deaths a year to radon, a best estimate from its 2003 risk assessment with an uncertainty range of 8,000 to 45,000. (Source: EPA, Health Risk of Radon, 2003)
- About 2,900 of the radon-related US lung cancer deaths EPA estimates each year occur among people who have never smoked. (Source: EPA, Health Risk of Radon, 2003)
- EPA’s indicator estimates US homes at or above 4 pCi/L with no mitigation system rose from about 6.2 million to 7.1 million between 1990 and 2013, using a 1992 survey that put about one in 15 homes in its ‘should test’ group at that level. (Source: EPA, Report on the Environment: U.S. Homes At or Above EPA’s Radon Action Level, 2013)
- Colorado’s health department says approximately half of homes in the state have radon above EPA’s 4.0 pCi/L action level, in a January 2026 release that gives no data year. (Source: Colorado Department of Public Health and Environment, press release on radon, 2026)
- Colorado’s health department distributed more than 12,500 free radon test kits to state residents in early 2025. (Source: Colorado Department of Public Health and Environment, press release on radon, 2025)
- Minnesota’s health commissioner said in January 2024 that only about 1% or 2% of the state’s homes are tested for radon each year. (Source: Minnesota Department of Health, news release on radon, 2024)
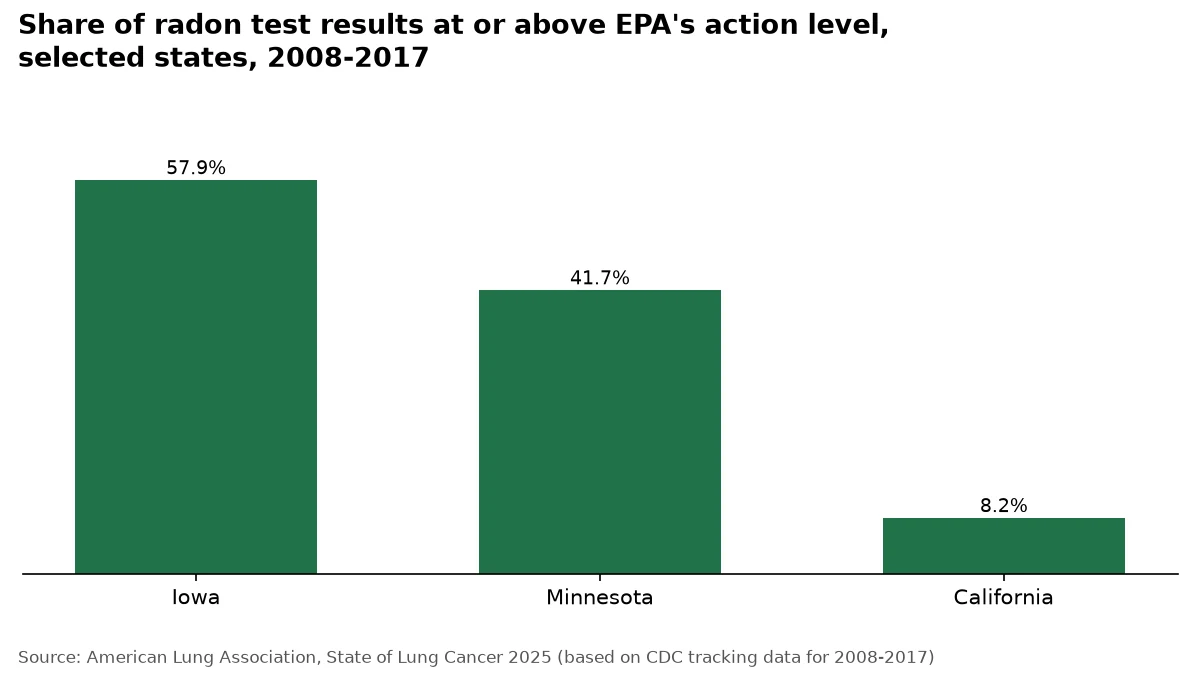
- The American Lung Association reports that 57.9% of radon test results in Iowa were at or above EPA’s action level; its State of Lung Cancer methodology says radon figures use CDC test data for 2008-2017. (Source: American Lung Association, State of Lung Cancer 2025: Iowa, 2017)
- The American Lung Association reports that 41.7% of radon test results in Minnesota were at or above EPA’s action level; its State of Lung Cancer methodology says radon figures use CDC test data for 2008-2017. (Source: American Lung Association, State of Lung Cancer 2025: Minnesota, 2017)
- The American Lung Association reports that 8.2% of radon test results in California were at or above EPA’s action level; its State of Lung Cancer methodology says radon figures use CDC test data for 2008-2017. (Source: American Lung Association, State of Lung Cancer 2025: California, 2017)
Related: air quality monitors that measure radon.
Carbon monoxide and gas stoves
CDC reports more than 400 unintentional non-fire CO deaths a year, only 55% of surveyed households reported CO alarms, and studies link gas stoves, the most-used range type in 36.75 million homes, to indoor nitrogen dioxide and benzene.
- CDC reports that each year more than 400 Americans die from unintentional carbon monoxide poisoning not linked to fires, more than 100,000 visit an emergency department and more than 14,000 are hospitalized. (Source: CDC, About Carbon Monoxide Poisoning, 2026)
- CPSC estimated 274 unintentional non-fire carbon monoxide deaths tied to consumer products in the US in 2022, the highest of the 2012-2022 period it reviewed. (Source: US Consumer Product Safety Commission, Non-Fire CO Deaths 2022 Annual Estimates (May 2026))
- Gas ranges were associated with an estimated 16 of the 274 non-fire consumer-product carbon monoxide deaths in 2022; CPSC lists them among devices known or suspected to have been used to heat an enclosed space. (Source: US Consumer Product Safety Commission, Non-Fire CO Deaths 2022 Annual Estimates (May 2026))
- In a CPSC national household survey completed in 2024, 55% of US households reported having carbon monoxide alarms installed, compared with about 99% for smoke alarms. (Source: US Consumer Product Safety Commission, Smoke and CO Alarm (SCOA) Survey Report, 2024)
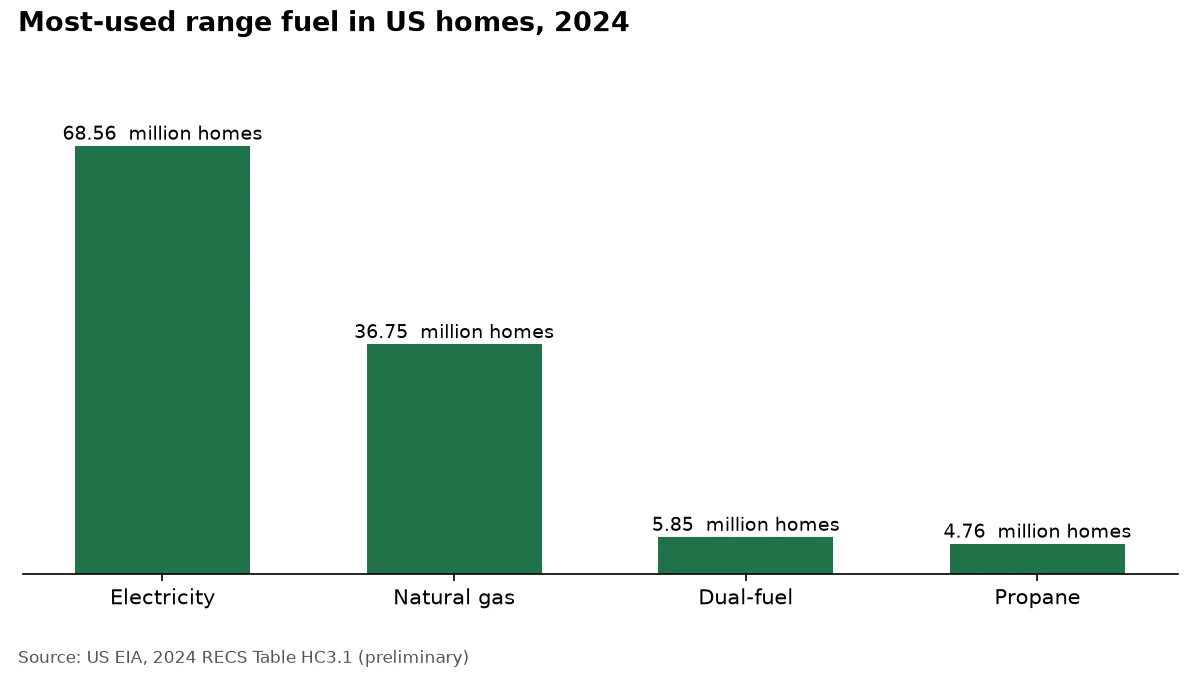
- In 2024, natural gas was the most-used range fuel in 36.75 million of 132.54 million US homes, behind electricity at 68.56 million, with dual-fuel ranges in 5.85 million and propane in 4.76 million. (Source: US Energy Information Administration, 2024 RECS Table HC3.1)
- A modeling study attributed 12.7% of current childhood asthma in the US to gas stove use (95% CI 6.3-19.3%), using earlier association estimates and exposure data, not a direct count of cases. (Source: Gruenwald et al., International Journal of Environmental Research and Public Health 2022 (PubMed Central copy), 2019)
- A Stanford-led model estimated that gas and propane stoves add 4.0 parts per billion to long-term nitrogen dioxide exposure on average across the US, equal to 75% of the World Health Organization’s guideline. (Source: Kashtan et al., Science Advances 2024 (PubMed Central copy))
- In tests of stoves in 87 California and Colorado homes, mean benzene emissions from gas and propane burners on high and ovens at 350°F were 10 to 25 times higher than from electric coil and radiant stoves. (Source: Kashtan et al., Environmental Science & Technology 2023, abstract on Stanford Natural Gas Initiative page)
Related: how to improve indoor air quality, air purifiers for VOCs and gases.
Dampness and mold
Estimates depend heavily on the definition: 3.9 million of 133.2 million occupied US homes reported mold in 2023 under a narrow survey question, while older studies of any dampness or mold averaged 47%.
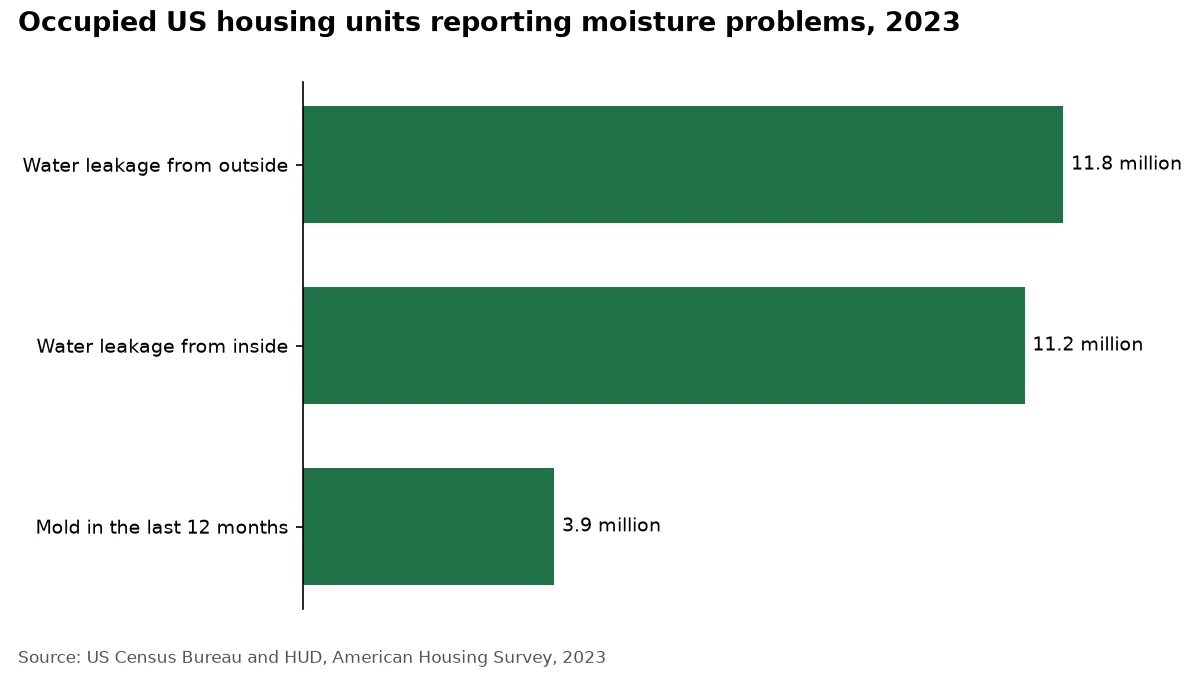
- Of 133.2 million occupied US housing units in 2023, 3.9 million reported mold in the last 12 months, according to the American Housing Survey. (Source: US Census Bureau and HUD, 2023 American Housing Survey infographic: Housing Quality)
- Of 133.2 million occupied US housing units in 2023, 11.8 million reported water leakage from outside their home, according to the American Housing Survey. (Source: US Census Bureau and HUD, 2023 American Housing Survey infographic: Housing Quality)
- Of 133.2 million occupied US housing units in 2023, 11.2 million reported water leakage from inside their home, according to the American Housing Survey. (Source: US Census Bureau and HUD, 2023 American Housing Survey infographic: Housing Quality)
- A population-weighted average across seven studies of US homes put the prevalence of dampness or mold at 47%, the input Berkeley Lab cites for a 2007 national asthma estimate; the underlying studies are older. (Source: Berkeley Lab, Reducing Dampness and Mold, 2007)
- Mudarri and Fisk estimated in 2007 that 21% of current US asthma (confidence limits 12% to 29%) was attributable to dampness or mold in homes, an estimate based on statistical associations, as summarized by Berkeley Lab. (Source: Berkeley Lab, Reducing Dampness and Mold (summarizing Mudarri and Fisk, Indoor Air, 2007))
- Mudarri and Fisk’s 2007 estimate put the annual economic benefit of eliminating dampness in US homes, through less current asthma, at $3.5 ($2.1 to $4.8) billion, mainly from lower medical care costs. (Source: Berkeley Lab, Reducing Dampness and Mold (summarizing Mudarri and Fisk, Indoor Air, 2007))
- Meta-analyses by Fisk, Lei-Gomez and Mendell associated building dampness and mold in homes with approximately 30% to 80% increases in a variety of respiratory and asthma-related health outcomes. (Source: Fisk, Lei-Gomez and Mendell, Meta-Analyses of the Associations of Respiratory Health Effects with Dampness and Mold in Homes (OSTI record), 2007)
- WHO’s 2009 guidelines estimate that indoor dampness affects 10–50% of indoor environments in Europe, North America, Australia, India and Japan, with wide variation within and among countries and climate zones. (Source: WHO, Guidelines for Indoor Air Quality: Dampness and Mould, 2009)
Related: the best air purifiers for mold, the ideal indoor humidity.
Schools and workplaces
GAO estimated 41 percent of US school districts needed HVAC work in at least half of their schools in 2019 and 38.5% of schools reported HVAC upgrades by 2022, while 80 percent of schools rated their own indoor air good or excellent in December 2024.
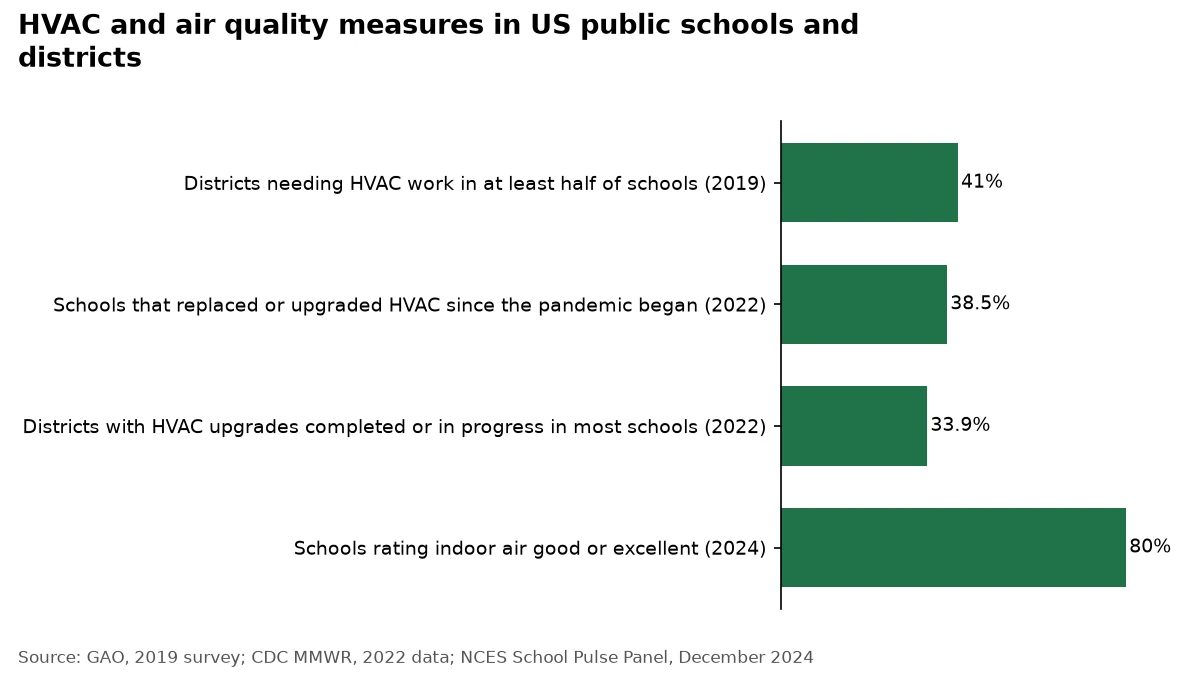
- GAO estimated from a 2019 survey that 41 percent of US public school districts needed to update or replace HVAC systems in at least half of their schools. (Source: GAO, K-12 Education: School Districts Frequently Identified Multiple Building Systems Needing Updates or Replacement (GAO-20-494), 2019)
- GAO estimated from a 2019 survey that about 36,000 US public schools needed HVAC updates, counting schools in districts where at least half of schools needed that work. (Source: GAO, K-12 Education: School Districts Frequently Identified Multiple Building Systems Needing Updates or Replacement (GAO-20-494), 2019)
- In December 2024, 80 percent of US public schools rated their overall indoor air quality as good or excellent in the NCES School Pulse Panel, an experimental, self-reported survey of 1,490 schools. (Source: NCES, School Pulse Panel press release, February 2025, 2024)
- Thirty-nine percent of US public schools had an Indoor Air Quality Coordinator on campus in December 2023, according to the NCES School Pulse Panel, an experimental data product. (Source: NCES, School Pulse Panel press release, February 15, 2024, 2023)
- In a CDC analysis of a national K-12 sample surveyed February 14 to March 27, 2022, 38.5% of public schools said they had replaced or upgraded HVAC systems since the pandemic began. (Source: CDC MMWR, Ventilation Improvement Strategies Among K-12 Public Schools, June 2022)
- In a CDC telephone survey of 8,410 US K-12 public school districts in August to December 2022, 33.9% reported HVAC replacement or upgrades completed or in progress in most schools; status was unknown for 43.4%. (Source: CDC MMWR, Ventilation Improvements Among K-12 Public School Districts, April 2023, 2022)
- In a Harvard-led controlled study of 24 office workers in November 2014, cognitive function scores averaged 101% higher on the two days simulating green buildings with enhanced ventilation than on the conventional-building day, and 61% higher on the green-building day. (Source: Allen et al., Environmental Health Perspectives, 2016 (COGfx study), 2014)
- In a vendor survey by GPS Air, which sells indoor air quality products, 61% of 750 US adults in non-remote jobs said they would choose fresher, more comfortable air over better amenities for a full workday (Pollfish, March 2026). (Source: GPS Air, press release on the 2026 Indoor Air Quality Report (vendor survey))
- A two-year study of 162 US classrooms, summarized by Berkeley Lab, associated each added 2 cfm (1 L/s) per person of ventilation with a 1.6% decrease in student absence. (Source: Berkeley Lab, Ventilation Rates and Absences in Offices and Schools, 2013)
- A modeling analysis summarized by Berkeley Lab estimated that raising US office ventilation to 32 cfm per person where rates were lower could bring benefits worth $13.5 billion a year, or $9.0 billion using a different data set. (Source: Berkeley Lab, Increased Ventilation Rates, 2011)
Related: the air changes per hour calculator.
Who uses air purifiers, and whether they work
Fewer than 4 in 10 US adults used a portable air cleaner at home in August 2023, and while trials and field studies often report sizable indoor PM2.5 reductions, results vary widely and the blood pressure associations are small.
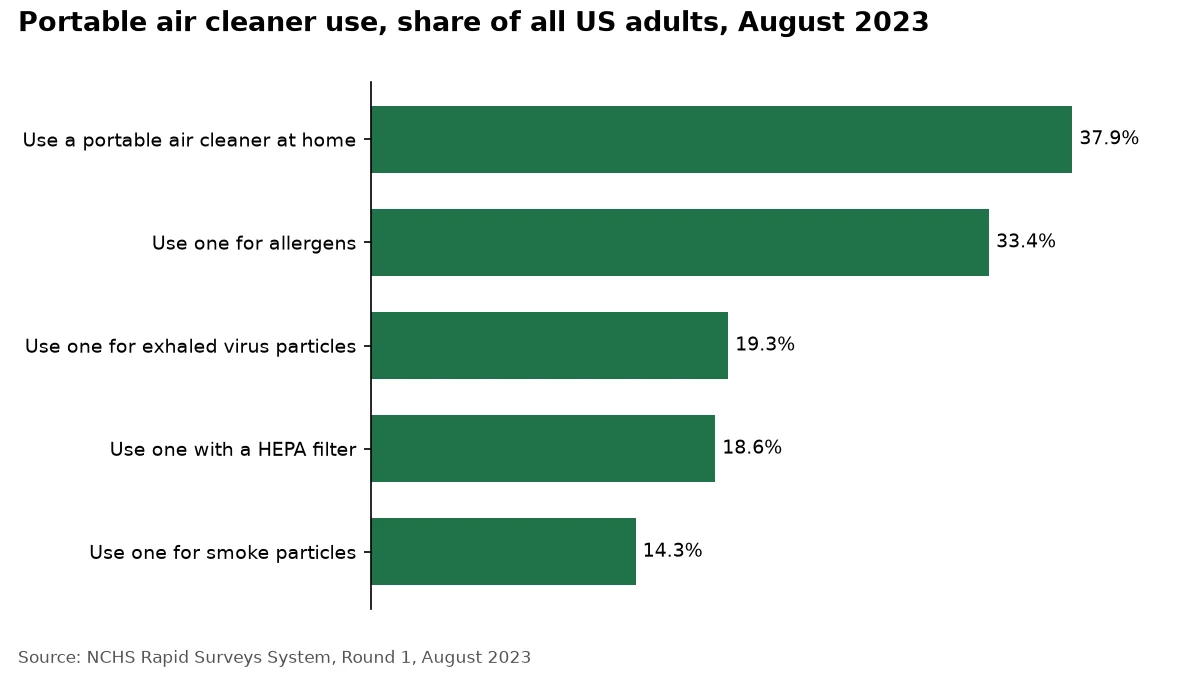
- In August 2023, 37.9% of US adults said they use a portable air cleaner or purifier at home (95% CI 36.6-39.3), according to the NCHS Rapid Surveys System, a probability-based online panel survey of 7,599 adults. (Source: NCHS, Rapid Surveys System, Round 1, 2023)
- In August 2023, 18.6% of all US adults said they use a portable air cleaner with a HEPA filter, and another 11.9% said they use one but don’t know whether it has a HEPA filter (NCHS Rapid Surveys). (Source: NCHS, Rapid Surveys System, Round 1, 2023)
- As a share of all US adults in August 2023, 33.4% use a portable air cleaner for dust, pollen or other allergens, 19.3% to remove exhaled virus particles and 14.3% to remove smoke particles; the reasons overlap (NCHS Rapid Surveys). (Source: NCHS, Rapid Surveys System, Round 1, 2023)
- Among US adults who don’t use a portable air cleaner at home, 66.3% said they didn’t think one was needed, 59.0% said it was too expensive and 30.2% said too noisy; reasons overlap (NCHS Rapid Surveys, August 2023). (Source: NCHS, Rapid Surveys System, Round 1, 2023)
- During the January 2025 Eaton Fire, 11 Los Angeles homes running HEPA purifiers had indoor PM2.5 3 µg/m³, or 15%, lower than 16 sham-control homes in ongoing randomized trials, a difference the authors called significant but modest. (Source: npj Clean Air, Fine particulate matter levels and HEPA filtration in Los Angeles homes during a wildland-urban-interface fire, 2025)
- A 2024 systematic review of field studies of portable air cleaners found that the 83 papers measuring PM2.5 reported a mean reduction of 49%, with a standard deviation of 20%, ranging from no significant reduction to above 90%. (Source: Ebrahimifakhar et al., Science of the Total Environment, on Oak Ridge National Laboratory’s publication page, 2024)
- A meta-analysis of 10 sham-controlled trials with 604 nonsmoking participants found portable air cleaners cut indoor PM2.5 by 55.9% on average and were associated with systolic blood pressure 3.94 mmHg lower over a median 13.5 days. (Source: Walzer et al., Hypertension, The Effects of Home Particulate Air Filtration on Blood Pressure, 2019)
- Among 40 older adults in a low-income Detroit senior building, 3 days of any air filtration compared with sham was associated with systolic blood pressure 3.2 mm Hg lower in a randomized crossover trial run from 2014 to 2016. (Source: Morishita et al., JAMA Internal Medicine, 2016)
- In a crossover trial of 154 adults living near highways, those with systolic pressure above 120 mmHg averaged 2.8 mmHg lower after a month of HEPA filtration and 0.2 mmHg higher with sham, a 3.0 mmHg difference; no significant change at normal pressure. (Source: American College of Cardiology, release on Brugge et al. in JACC, 2025)
Related: whether air purifiers work, air purifier side effects.
Energy use, sizing and standards
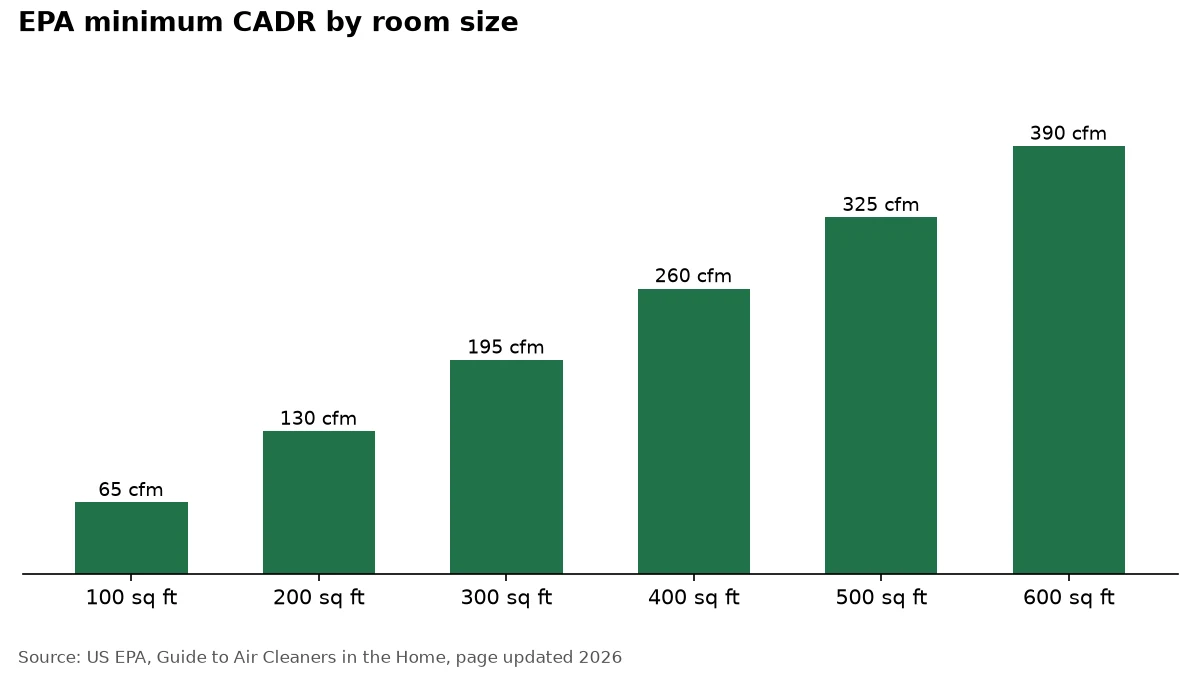
A standard room air cleaner run nonstop uses about 394 kWh a year, ENERGY STAR models are rated more than 50% more efficient, and EPA’s sizing chart ties room area to a minimum clean air delivery rate.
- ENERGY STAR estimates that a standard room air cleaner running continuously uses about 394 kWh of electricity a year. (Source: ENERGY STAR, Air Cleaners, 2025)
- ENERGY STAR says certified room air cleaners are more than 50% more energy-efficient than standard models, saving about 211 kWh/year and roughly between $18 and $40 a year depending on size. (Source: ENERGY STAR, Air Cleaners, 2025)
- Federal air cleaner standards set minimum efficiency of 1.7 to 2.0 PM2.5 CADR/W from December 31, 2023 and 1.9 to 2.9 from December 31, 2025, by size class. DOE proposed withdrawing them in May 2025 and listed no final action as of November 2026. (Source: US DOE, Federal Register, 88 FR 60105, Confirmation of Effective and Compliance Dates, 2025)
- DOE’s 2023 rule projected full-fuel-cycle savings of 1.80 quads for air cleaners bought from 2024 to 2057, 27 percent below a no-standards case, with net consumer benefits of $5.8 billion to $13.7 billion depending on discount rate. (Source: US DOE, Federal Register, 88 FR 21752, Direct Final Rule, 2023)
- EPA’s sizing chart lists a minimum CADR of 65 cfm for a 100 sq ft room, then 130, 195, 260, 325 and 390 cfm for rooms of 200, 300, 400, 500 and 600 sq ft, assuming an 8-foot ceiling. (Source: US EPA, Guide to Air Cleaners in the Home, 2026)
- AHAM, the appliance manufacturers’ trade group, bases its Verifide suggested room sizes on 4.8 equivalent air changes per hour, which it calculates gives an 80% continuous reduction in smoke particles assuming 1 air change per hour of infiltration. (Source: AHAM, Consumer Room Air Cleaners and Equivalent Air Changes per Hour (trade association white paper), 2026)
- Since 2010, portable air cleaners sold in California must be CARB-certified, and electronic models must test at an ozone concentration no greater than 0.050 parts per million. CARB says certification doesn’t reflect how well a device cleans air. (Source: California Air Resources Board, List of CARB-Certified Air Cleaning Devices, 2026)
- US households paid an average of 17.23 cents per kilowatthour for electricity in 2025, up from 16.48 cents in 2024; the preliminary 2026 average through August was 18.19 cents, EIA reports. (Source: US EIA, Electric Power Monthly, Table 5.3, 2025)
Related: the air purifier size calculator, the electricity cost calculator, what CADR means.
Our own analysis: certification listings and spec sheets
New listings on California’s certification list have shifted heavily toward units CARB types as Mechanical since 2024, while spec sheets often leave out numbers such as carbon weight.
- California’s certified air cleaner list held 13,166 listings when we read it on November 5, 2026, with the latest notified on September 30, 2026; a listing is one brand and model entry, so rebranded units count separately. (Source: Clean Air Guides analysis of the CARB certified air cleaner list, 2026)
- Of the 13,166 CARB listings, 7,861 are typed Mechanical and 5,305 Electronic, which makes 40.3% Electronic (5,305 / 13,166), counting a few misspelled type labels as the type they clearly mean. (Source: Clean Air Guides analysis of the CARB certified air cleaner list, 2026)
- Electronic units made up 51.5% of the 2,497 CARB listings notified in 2022 (1,285 / 2,497), the highest share of the 2021 to 2026 period. (Source: Clean Air Guides analysis of the CARB certified air cleaner list, 2022)
- Electronic units made up 15.5% of the 1,926 CARB listings notified in 2025 (299 / 1,926), down from 51.5% in 2022. (Source: Clean Air Guides analysis of the CARB certified air cleaner list, 2025)
- Electronic units made up 13.1% of the 1,009 CARB listings notified from January to September 2026 (132 / 1,009). (Source: Clean Air Guides analysis of the CARB certified air cleaner list, 2026)
- The Electronic share of new CARB listings was 50.7% in 2021 (762 / 1,504), 49.3% in 2023 (649 / 1,316) and 22.6% in 2024 (315 / 1,393). (Source: Clean Air Guides analysis of the CARB certified air cleaner list, 2024)
- The list shows 1,360 distinct brand names as printed but only 8,479 distinct model numbers across 13,166 listings, because the same model number can appear under more than one brand. (Source: Clean Air Guides analysis of the CARB certified air cleaner list, 2026)
- The 13,166 CARB listings sit under 3,226 executive order numbers, an average of 4.08 listings per order (13,166 / 3,226). (Source: Clean Air Guides analysis of the CARB certified air cleaner list, 2026)
- Of the 49 air purifiers and in-duct filters in our research file, 29 of 49 have a smoke CADR on record, including 26 of the 37 portable models. (Source: Clean Air Guides product research file, 2026)
- Across the 29 models in our file with a smoke CADR, the median is 233 cfm, and values run from 34 to 600 cfm. (Source: Clean Air Guides product research file, 2026)
- In our file, 30 of 49 models have no ionizer, 9 have one that can be switched off, 5 have one that is always on and 5 use electrostatic charging. (Source: Clean Air Guides product research file, 2026)
- Only 5 of the 35 models in our file with some carbon media, including optional filters, have a published carbon weight. (Source: Clean Air Guides product research file, 2026)
- In our file, 16 of 49 models carry a marketed room size based on 1 or 2 air changes per hour, well below the roughly 4.8 air changes behind AHAM’s two-thirds sizing rule, so those room sizes aren’t comparable. (Source: Clean Air Guides product research file, 2026)
- Of the 49 models in our file, 40 of 49 are CARB-certified, 5 are in-duct or passive filters outside certification and 4 aren’t listed. (Source: Clean Air Guides product research file, 2026)
Related: what CADR means, how ionic air purifiers work, how we research products.
How we compiled these statistics
We looked for the organization that collected each figure and cited its own page where we could open it. Each number was read on the cited page, and each claim was compared with the sentence or table around it for population, unit, country and year.
An automated checker confirmed 88 figures on their pages. The other 41 were recorded by hand: 27 were checked in a second read because the checker couldn’t open the page (mostly PDFs and PubMed Central articles), and 14 are our own counts.
We removed figures we couldn’t confirm in that second read, including a Gallup poll figure and a clean cooking total from IRENA’s copy of the Tracking SDG7 report. A few sources are JSON data feeds or a university’s or repository’s copy of an abstract, because the publisher’s page couldn’t be opened.
The year shown is the year the data describes where the source states it. Where it doesn’t, we use the page’s update date, the publication year or the year a rule took effect. Some long-standing figures are old, and we show their real age: EPA’s 90 percent and 2 to 5 times figures rest on sources from 1989 and 1987.
Recency threshold: our standard for this kind of page is 70% of figures dated within two years. Much indoor air data is older, so the site owner approved a 40% threshold before research began. 48 of the 115 third-party figures (42%) are labeled 2024 or later, and 35 of those (30% of the 115) describe data measured in that period. The other 13 carry a publication, update or in-force year, or are projections.
Where sources conflict, we name each one rather than pick silently. EPA’s radon page gives about 21,000 deaths and also about 15,000 from the BEIR VI model. Global household air pollution deaths are 2.9 million for 2021 (WHO) and 2.8 million for 2023 (State of Global Air). AAFA and CDC give different asthma death counts for 2024, and we use CDC’s. Canadian government sources give different 2025 burned-area totals, and we use the higher one from Environment and Climate Change Canada, reported as roughly 8.9 million hectares.
We left out national purifier ownership figures from vendor surveys when we couldn’t read a method and sample size. One vendor survey (GPS Air) is included and named as one. Many health figures here are estimates or associations and don’t show cause. This page isn’t medical advice.
We plan to recheck the figures quarterly. Live or changing items include NIFC’s year-to-date wildfire count and the status of the federal air cleaner standards, which DOE proposed withdrawing in May 2025.
How we counted our own data
Two sources. First, we counted every row of the table on the California Air Resources Board’s list of certified air cleaning devices, read on November 5, 2026 (13,166 listings, latest notified September 30, 2026). A listing is one brand and model entry, so rebranded units count separately and the counts don’t measure sales or distinct products. Types are CARB’s own labels, with a few misspellings normalized; a type label may not match a maker’s marketing. Years use the Date Notified column, and 2026 is partial. Second, we counted fields in our own research file of 49 air purifiers and in-duct filters, compiled October 20, 2026 from manufacturers, AHAM, ENERGY STAR and CARB. It’s a set we chose to cover, across 21 brands, and not a representative sample of the market. One smoke CADR in it (Winix 5500-2) comes from a secondary source. The minimum sample for these stats was set at 29, below the 1,000 default, with the site owner’s approval.
Frequently asked questions
How much time do Americans spend indoors?
EPA says Americans spend approximately 90 percent of their time indoors on average, a figure it footnotes to a 1989 report. In a survey run from 1992 to 1994, respondents reported spending an average of 87% of their time in enclosed buildings and about 6% in enclosed vehicles.
Is indoor air more polluted than outdoor air?
It depends on the pollutant. EPA says some pollutants are often 2 to 5 times higher indoors, citing a 1987 study. For PM2.5, time-averaged indoor levels were below outdoor levels in 92% of 3,977 US homes with PurpleAir monitors in 2021 and 2022, a volunteer sample rather than a random one.
How many people die from radon in the US each year?
EPA attributes about 21,000 US lung cancer deaths a year to radon, including about 2,900 among people who have never smoked. The same EPA page also gives about 15,000 deaths from the BEIR VI model, so treat these as estimates.
How many Americans use an air purifier?
In August 2023, 37.9% of US adults said they use a portable air cleaner or purifier at home, according to the National Center for Health Statistics. Only 18.6% said they use one with a HEPA filter.
Related guides
Guides
Do Air Purifiers Work? What They Remove, What They Can't and When They're Worth It
Yes, for particles in the air: smoke, pollen, pet dander and dust. Here's what EPA and AHAM say purifiers can and can't do, and how to size one so it works.
7 min read

Guides
How to Improve Indoor Air Quality: 9 Steps in the Order That Works
Cut pollution at the source, bring in outdoor air, then filter what's left. Nine EPA-based steps, from humidity and mold to purifiers and radon.
7 min read
Guides
Wildfire Smoke Indoors: How to Protect the Air in Your Home
Close up the house, set up one cleaner air room and run a CARB-certified air purifier sized for smoke on high. Here's EPA's plan, step by step.
7 min read

Guides
Best Air Quality Monitors of 2026: Radon, CO2 and PM2.5 Picks
Seven current home air quality monitors, picked on the sensors manufacturers actually document: true NDIR CO2, laser PM2.5 counters and radon.
12 min read